
Insights-X reportings provide you detailed information about your connectivity, bookings and market trends (benchmark). Whether you are selling or buying on TravelgateX, we recommend to have a look at our reportings and analyze your connections: searches, quotes, bookings, cancellations, distribution errors, etc.
Performance Daily Report
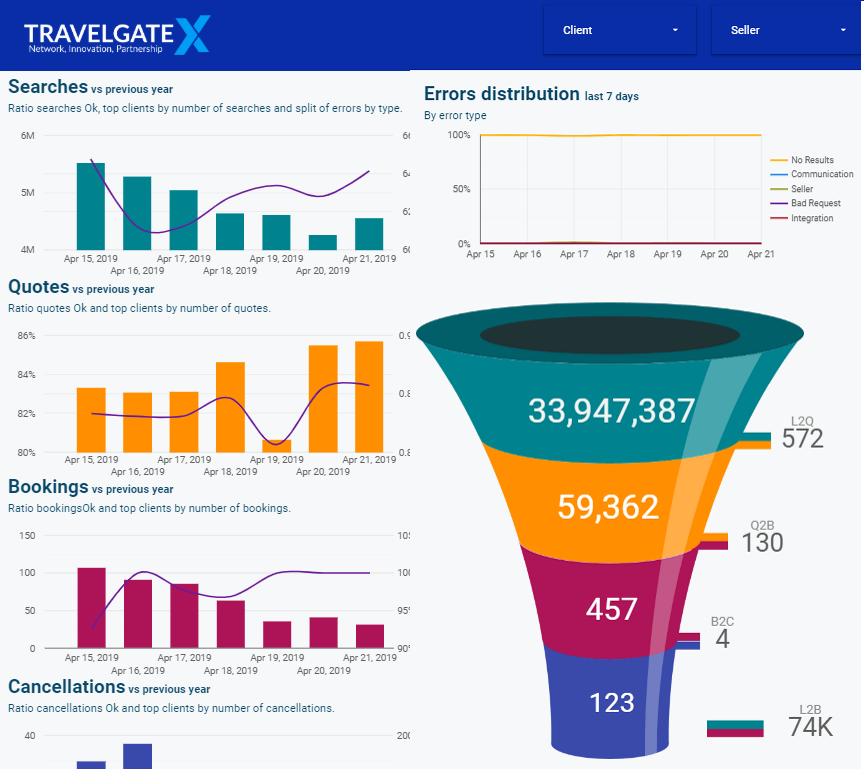
Get insights on your most relevant KPIs and compare the evolution year over year.
This page shows trends of your main indicators and your top clients/suppliers connected with you through TravelgateX platform for the last seven days :
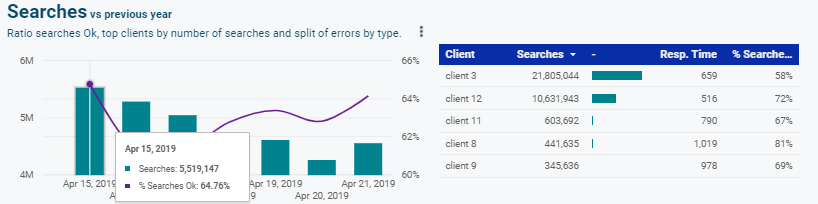
- Searches: what were my top clients/suppliers in terms of searches for the last seven days and what is their avg. response time? Use this graph to monitor the volume of searches and searches OK ratio for the last seven days to discover possible issues.
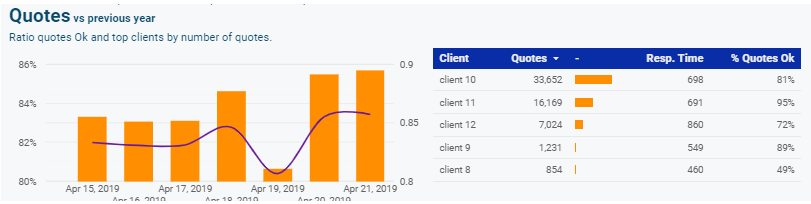
- Quotes: monitor volume of “Quotes”, “Quotes Ok” and identify possible issues comparing ratios year over year. Understand the behavior of your clients/suppliers for the last seven days and detect possible issues with metric “% Quotes OK”: identify lowest values and optimize the connections!
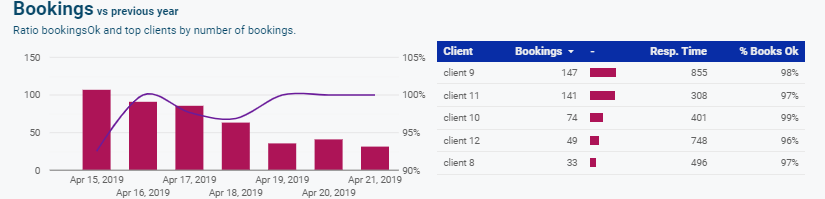
- Bookings: compared to last year, is your business growing in terms of bookings? How is changing the ratio “bookings OK” compared to the same period last year? Know your top clients/suppliers and do not forget to monitor the response time to identify possible issues:
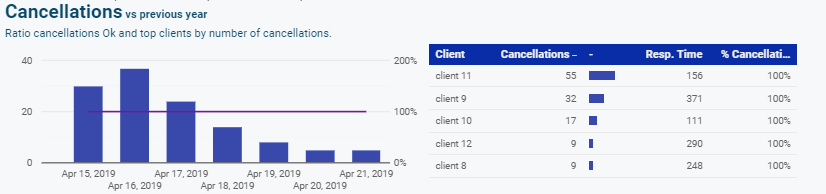
- Cancellations: did I have more cancellations for the last seven days compared to last year? What partners am I getting more cancellations from? This graph will answer your questions:
Monitor, optimize and reduce costs
Attention to detail when it comes to optimize and reduce costs is more than necessary, so to monitor all indicators to one specific supplier/client: select and apply filters on the top of the page; all metrics will be loaded according to the selected filter.
In this page you will see your global or specific for one client/supplier booking funnel: analyze ratios, improve your L2B and start reducing extra cost while increasing your bookings volume.
To conclude, all Insights-X data is available on different temporal aggregations: daily, weekly and monthly and is available in our datasets compatible with BI tools like Tableau, MicroStrategy or Power BI. If you prefer, you can use our Data Studio template to load your datasets and monitor your business through TravelgateX Platform.