
Would you like to monitor your demand and increase your bookings on specific destinations? InsightsX provides you detailed information about your demand through TravelgateX platform at a destination level.
Whether you are buying or selling on TravelgateX, the report “Destination Demand” will guide you to identify missed opportunities and improve your business.
Insights-X is a BI solution with accurate data about all your transactions: searches, quotes, bookings and cancellations.
Insights-X has now a new report page in order to give our connected partners more insights on how to identify missed opportunities and errors. Suppliers or clients will get full information on how their demand is behaving from a specific market source and they will be able to target the errors by applying different filters.
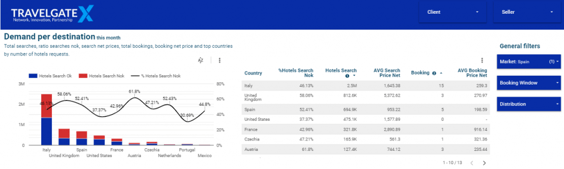
First, the report shows the top countries in terms of a number of hotels requested for the last month: a total of “Hotels Search Ok”, “Hotels Search Nok” and “%Hotels Search Nok”. You should pay attention to those countries where you had a higher volume of searches and the percentage of “Hotels Search Nok” was high too: that is an indicator that something is not going well.
To compare how your prices change during the funnel, have a look at the table close to the graph and see how different your net prices are on search and booking. To accurate your results, we recommend you to apply the filters: origin market, booking window and distribution. Then, you will be able to see if your requests are returning errors for a specific period of time and number of guests.
Now that you know you how to identify “Searches Nok” at a country level, let’s dig in the detail. Our reports will show you where your searches are not working properly up to city level. For that, you can use the drill-down functionality in Data Studio reports.
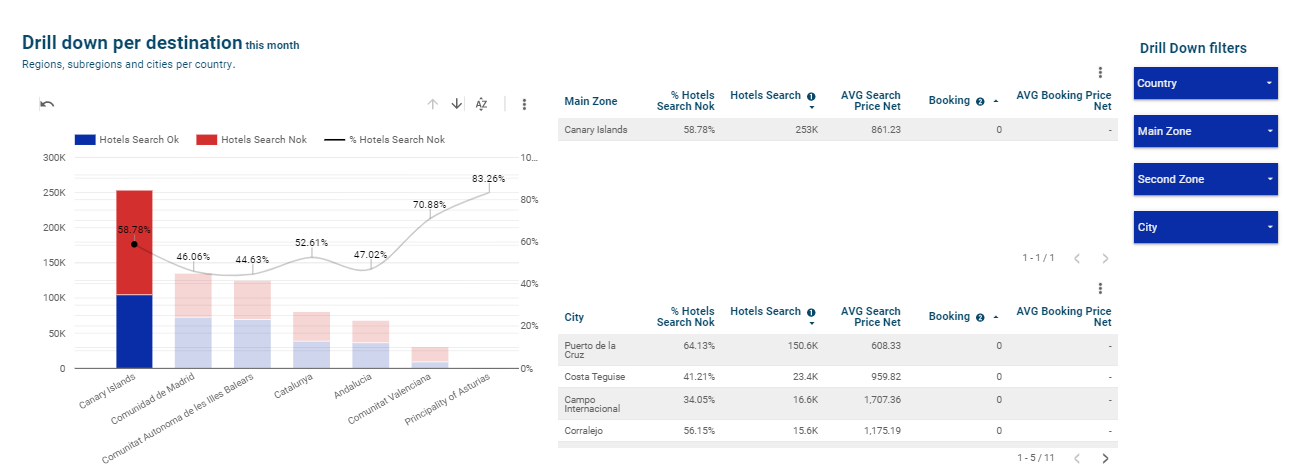
First of all, click on the region you want to analyze your “Searches Nok” and click on the arrow above the graph to drill down from the main zone to the second zone.
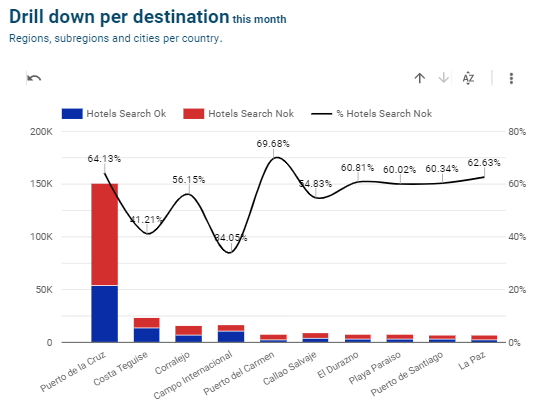
Repeat the process again to drill down up to city, the last level of detail. While you are drilling down, the results on the table drill as well so that you can see the detailed data for the selected zones or cities.
Finally, remember that by applying the filters on the top “Buyer” or “Seller”, all insights will be targeted. Destination demand report provides useful and detailed data that will help you to identify those destinations and requests where you are missing sales and getting extra costs. Insights-X supports you not only to monitor and optimize your connectivity, but also to increase your business with your connected clients or suppliers.
